| |
Debugging Android Apps
Unless desktop operation systems, the Android OS does not have a multi-windowing GUI, because of the limited size of the screen only one window is displayed at the same time. The window belongs to a software component called an activity and an app often consists of only one activity. In more complicated situations an app may switch from one activity to another and so display several screens with different layouts. When an activity becomes active, it may take over the soft buttons MENU, BACK, VOLUME_INCREASE and VOLUME_DECREASE, but not the HOME button that always pops up the Home screen. As with all event driven systems, the button events are notified by callback methods. Android simplifies the usual Java event model because many callback methods are not part of a listener interface, but implemented as empty methods in the Activity class. By deriving this class and overriding these methods the application programmer gets its own event notifications. Because the class GameGrid is derived from Activity and a GameGrid app normally derives from GameGrid, the application class gets notified too.
In short, programming consists of designing, coding, testing and debugging, not really performed sequentially but in an evolutionary process by jumping from one task to the other. Because programming is not simple, the programmer commits errors that must be tracked down. Errors are not so much signs of the programmer's incompetence but more of a spirit for taking too much risks. Conservative programmers will commit fewer errors, but be slow and lack of inspiration and elegance. It's a greater challenge to find and fix runtime errors in a smartphone because the process is running on an external device. Fortunately the Android development system provides some powerful debugging tools, first of them the Android Debugging Bridge (adb). Consult the adb documentation on the Internet to get an idea of what you can do. Part of adb is a logging facilty LogCat that retrieves runtime information from the external device and displays them in a PC console window. The debug console displays important runtime system information that are flagged by a debug tag. This tag serves as filter to select only part of the information. JDroidLib also generates information automatically using the tag "ch.aplu.android". The distribution of the JDroidLib framework contains a GUI interface to the LogCat console and starter applications with 3 possible filters:
| ExecDebugAplu.jar: |
JDroidLib messages, messages send by class L |
| ExecDebugRT.jar: |
As above + Android realtime messages (e.g.null pointer exception) |
| ExecDebugAll.jar: |
All messages |
(If you prefer, you can start the debug console using the link in the right column. The WebStart signed by University of Berne will install all necessary files in <userhome>.jdroidlib and start ExeDebugRT.)
When we start ExecDebugRT.jar we see the following sequence of dialogs:
We now modify the program Ex01 to include extra debug information by writing out the value of variable i in the for-loop.
// Ex02.java
// For explanations, consult http://www.aplu/android/tutorial
package ch.aplu.tut;
import ch.aplu.android.*;
public class Ex02 extends GameGrid
{
private final int n = 10;
public void main()
{
GGPanel p = getPanel(0, n, 0, n);
for (int i = 0; i <= n; i++)
{
L.i("i = " + i);
p.line(i, 0, n, i);
}
}
}
|
When started, the debug window shows some library information and, as expected, the values of i:
Download Android app for installation on a smartphone or emulator.
Download sources (Ex02.zip).
Create QR code to download Android app to your smartphone.
Install/Start app on a USB connected smartphone or a running emulator.
(This is a WebStart signed by the University of Berne, Switzerland. It installs some helper files in <userhome>.jdroidtools.If you did not install the Android SDK, you may install a slim version of the Android-Emulator in <userhome>.jdroidemul using this link, To start the emulator, execute ExecEmul.jar found in <userhome>.jdroidemul)
If we produce volitionally a null pointer exception by setting GGPanel p = null, the debug console detects it precisely (even the source line number is correct).
Install/Start app on a USB connected smartphone or a running emulator
Download sources (Ex02a.zip)..
Create QR code to download Android app to your smartphone.
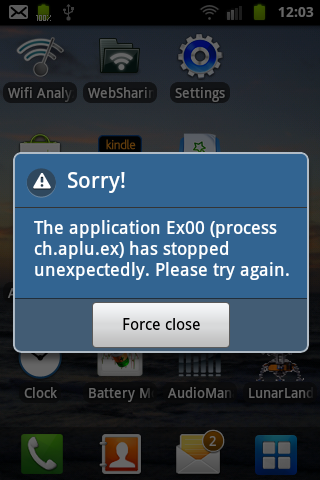
Because JDroidLib catches exceptions in the main() method and redirects stack trace information to the debug console, the app did not die by poping-up the featureless crash dialog box:
(Continued in Tutorial 3)
| |
 LinkUp
 TCPCom
 Simulations